
I generally think of the New York Times as something I might accidentally step in. But I always give credit where credit is due. I’m truly impressed with their Extremely Detailed Map of the 2016 Election. (Hat tip, to Ace of Spades (I think). Honestly, I can’t quite recall which blog pointed me there.)
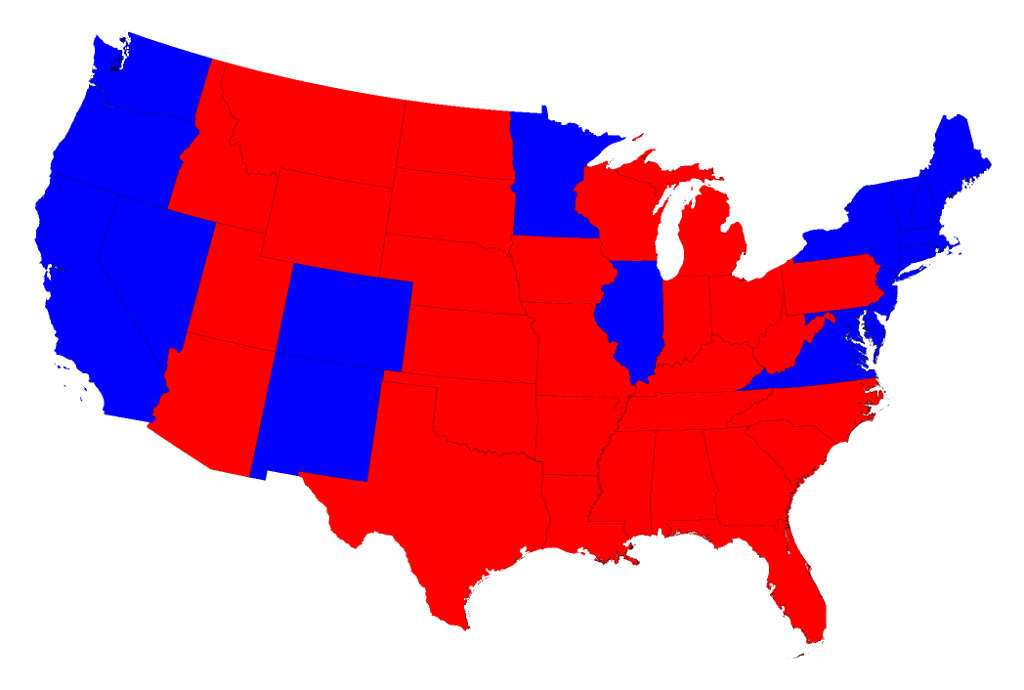
Maps serve a purpose beyond entertainment. They present information that would, in other communication methods, be harder to grok. Here’s an example. You’ve all seen the maps of which state voted R versus which states voted D. Here’s a simple version I found randomly on Google. If you look at it you “learn something”:
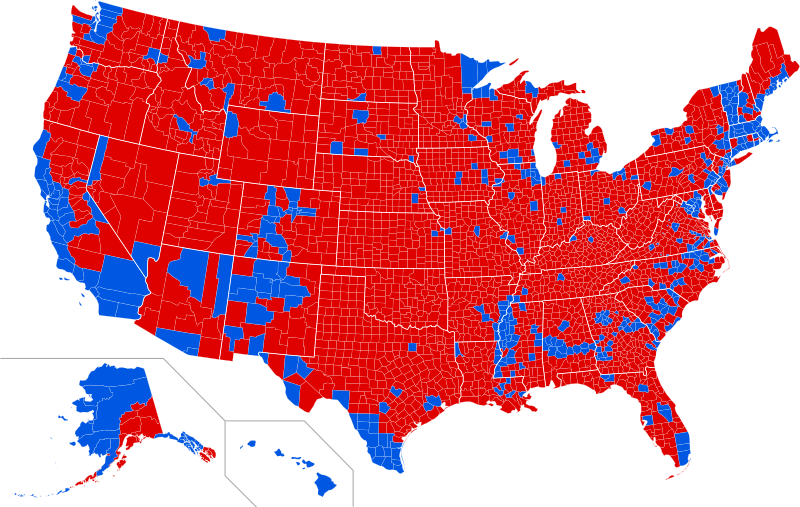
Suppose you look at it with more detail? Here’s a map of which counties voted R versus D. If you look at it you “learn more”:
With this interactive map you can drill down to very small areas. Neighborhoods really. I had no idea voting information had such fine granularity. So what does a clever monkey like me do with this groovy toy? Attempt to learn things, of course:
The press in the throes of confirmation bias that everyone is exactly like the enlightened, thoughtful, diverse urbanites who universally voted for the correct party:
The press is also struggling with cognitive dissonance that mysoginist, racist, embittered, knuckle dragging, right wing Deplorables are somehow not yet lined up and shot:
Gosh, with such a huge disparity between 100% blue and 100% red voting blocks, how will we make it through the month without a shooting war?
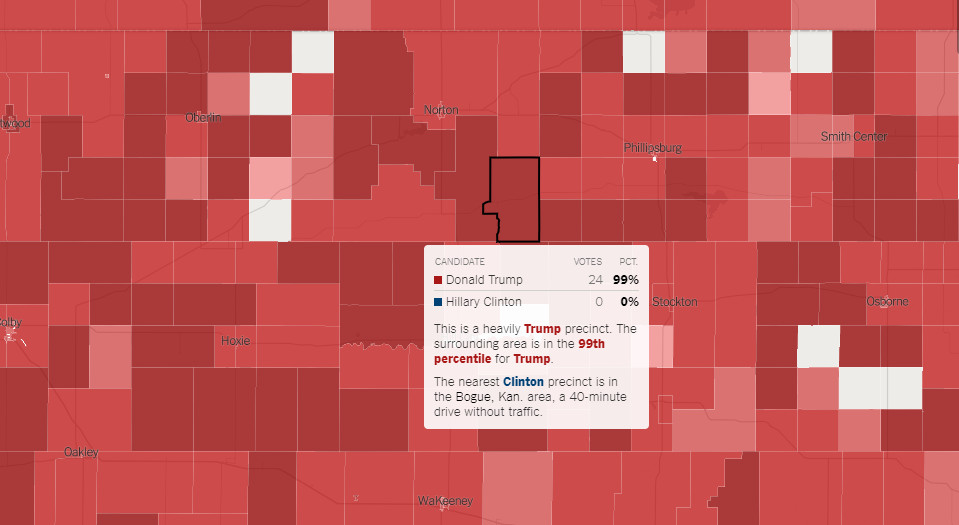
Well, what if I wandered around the map and in half a second I found this: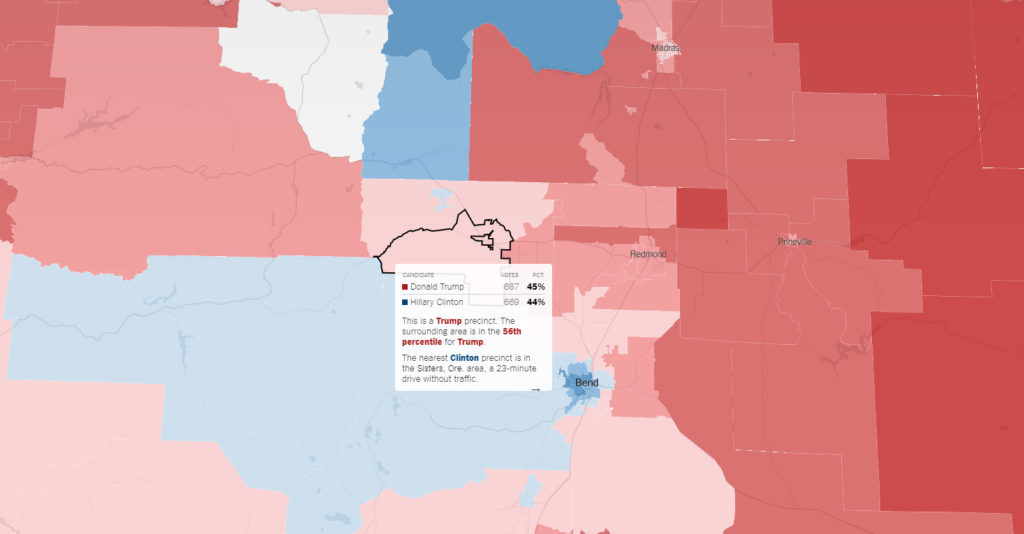
It took half a minute to find a precinct (is that the word?) that went for Trump over Hillary by a minuscule 687 to 669. A difference of 18 votes. That’s within 1.3% of a perfect coin flip. If I lined up 1356 voters, handed them a quarter and said “flip this” would 18 votes different be basically a wash?
Now I’m not saying America is one big happy family. Nor am I saying that the people of Detroit and Kansas will someday learn to get along. I’m not even saying some random spot northeast of Bend Oregon is some sort of peaceful Nirvana.
I’m just saying at a small scale you can see things you wouldn’t see elsewhere. Thinking about it tells me that both sides, with their “we’re too far apart and doomed to blows” may be oversimplifying. Maybe people self segregate and just like to bitch about the “other”. Maybe people will chill the hell out in time. Who knows? I’m just sayin’ the fat lady hasn’t yet sung and the press is turning the dial to eleven accentuating the negative until she does. Maybe it won’t all go to hell?
I’m hardly an optimist, but I’ve seen this before. USSR, the terrifying ICBM laden mutually assured destruction player of my youth, collapsed without a shot fired. The press, busily shitting on Reagan for the lead up to it, was caught flat footed. So were our intelligence agencies. I don’t know what they were doing then, but they’re so busy wiretapping politicians now that they’re surely missing a big picture elsewhere.
And back to USSR, or perhaps I can call it “the war that didn’t happen”, was that not a great thing? It could have been worse. Ironically, the side that wanted to “give peace a chance” with the mighty Russian bear seems determined to goad Trump into kicking Putin in the balls on live TV. Meanwhile, the side that was saber rattling under Reagan is nominally headed by an Orange Haired fella’ who is determined to turn our relationship into a far less shooty arrangement. He envisions a Coke versus Pepsi rivalry that is somewhat less likely to incinerate Baltimore. So when did the two sides switch? And did they wave at each other as they passed on the road?
Look at the large scale and look at the small. The press is out to drive us all nuts. Better knowledge is the antidote to gaslighting!
A.C.
P.S. One more thing. For those of you who wish to be the Grey Man, avoiding issues by carefully blending in, this map has a huge (or should I say “yuge”?) lesson. Even in a national presidential race, your “secret ballot” is far less secret than the state or county level totals I imagined. It’s something I didn’t know until today.
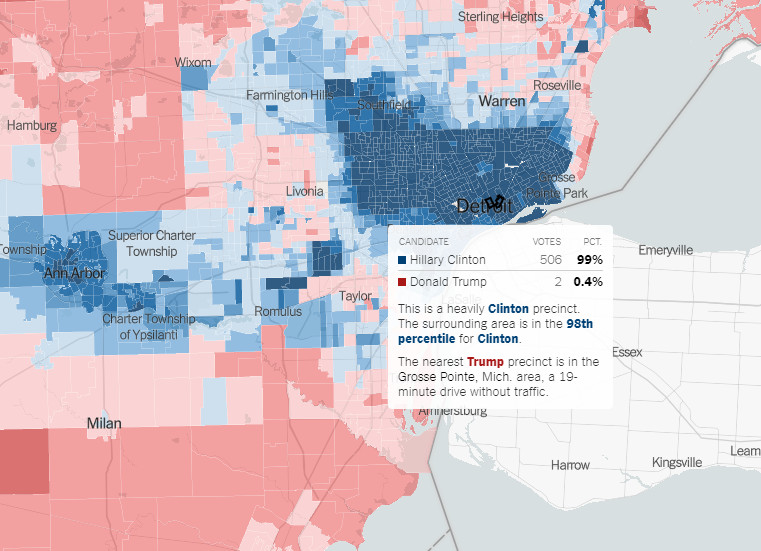
Up above, I showed an image of a voting precinct (?) with 24 Trump votes and none for his opponent. Below there’s a voting precinct (?) with 10 Hillary votes and none for her opponent. If you move into either area and honestly vote your mind you’re taking a risk. It wouldn’t take a rocket scientist to look at 2016 and then look at 2020 and “root out” the lonely dissenter with extreme precision. For that matter, what might happen to the two Trumpsters in the Detroit image? They’re in a small (a few blocks) area and outnumbered 506 to 2! These detailed vote counts can be the difference between a secret choice and Custer’s last stand!
Also, it doesn’t necessarily have anything to do with your neighbors. Even if your neighbors are great people who you’d trust with your life, your individual vote in very small, very blue, and very red districts might show up on the national scene. I’m just an idiot blogger playing with a map in another timezone and I found out stuff. Almost certainly a database search of public information can get you on some loon’s list of “problem people”; at least if you’re in a small and biased precinct(?).
It’s probably nothing. Likely just a tinfoil hat concern. However, if you’re dedicated to the Grey Man solution, these maps are telling you something.

What I find funny is this website is from the New York Times, which means their own people have access to this information and yet they act like this doesn’t exist?
Thanks for finding this. I looked at my local area and what I suspected about the local idiots around me. Sigh.
No shame in being surrounded by idiots. We’ve all been there. Good luck.
Waaaay back in 2012, on a car forum, in response to this comment:
https://www.club3g.com/forum/lounge/161989-withdraw-united-states-america.html#post3336861
I posted this :
https://www.club3g.com/forum/lounge/161989-withdraw-united-states-america.html#post3336977
I REALLY wish I had that district level map back then…
A better map would’ve made a better point, but only to people who are open to logical arguments; which as far as I can tell is a thin sliver of the electorate. Your point was plenty valid with the image you posted, and probably fell on deaf ears.
Looks like that was 2012. Six years later not much has changed. After Obama the “red/blue” thing is probably cemented into the nation for a generation. Back then a handful of blue cities that had hegemony over the vast land area of the nation and they liked it that way. Now the vast land area has squeaked out a win and the handful of blue cities are shitting themselves. The thing that changed isn’t the handful of blue cities or the sea of red land. There’s nothing different but who’s team is at the wheel and there’s nothing upsetting the blue cities except that they’re not in charge.
Back in 2008 I started getting an interest in history. Was the “unprecedented” world of 2008 really so new? I wondered if it wasn’t as dire (or unusual) as it felt. After plenty of reading I’m sure of it. Our current mass hysteria (and yes, I the term “mass hysteria” is appropriate) is neither new, nor unusual. I’m not saying it’s a good thing (it may even be dire) but clearly there’s nothing new under the sun.
What would be a more interesting map, at least to me, would be a map of how the Congressional districts voted. I became very interested in the Electoral College after the 2012 election. Every state has the same number of Electors as congressmen plus two for the Senators. I thought it would be better for the country if the Electoral votes were cast how the congressional district voted. It would be, what’s the word? Ah, representative! Get rid of this winner-takes-all crap. Make the candidates fight for every damn vote.
I find it really very funny when people say the college is outdated and obsolete. The college was enacted because the Founders had the same problems that we have today. Today New York and California could decide the election by popular vote. Back then it was New York City and Philadelphia. Funny that, isn’t it?