Once I had everything lined out I was shocked at what I saw. It seems like you can’t turn over a rock without the Government forming a rock relocation committee. I assumed the workforce has been growing like a waistline at Thanksgiving.
I was wrong!
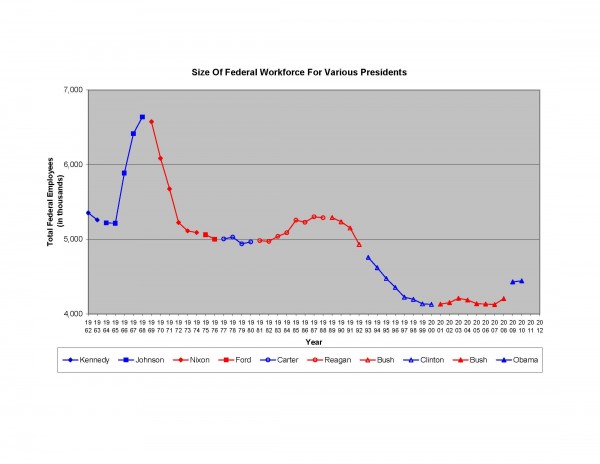

In the last 49 years (roughly) the government averaged about 5,000,000 employees with a big spike in the late 1960’s (Vietnam?). There has been fluctuation in between but compared to 1962 and the 2010 Fed is just under a million employees smaller. How is it that us “small government” fans aren’t aware of this? You’d think we’d be pleased with the overall trend. (Yes, yes… Some of you are attempting to hammer the word “contractor” into the nearest keyboard as fast as possible. That’s a topic for another time.)
I shall repeat this because it impressed me; the number of employees in Federal government in 2010 is smaller than in 1962. Who knew?
Another interesting thought, the US population increased in that time. Thus the relative size of the Fed diminished from 29 to 16 Feds per million Americans. Huzzah!
Now was the time to see if I would eat crow or not. This all started when I claimed that Reagan increased the size of government. Specifically he hired more Federal employees. I’d skated on thin ice. To some folks, bitching about Reagan increasing the size of government is like complaining that the Pope’s keg parties are too wild. Was I wrong?
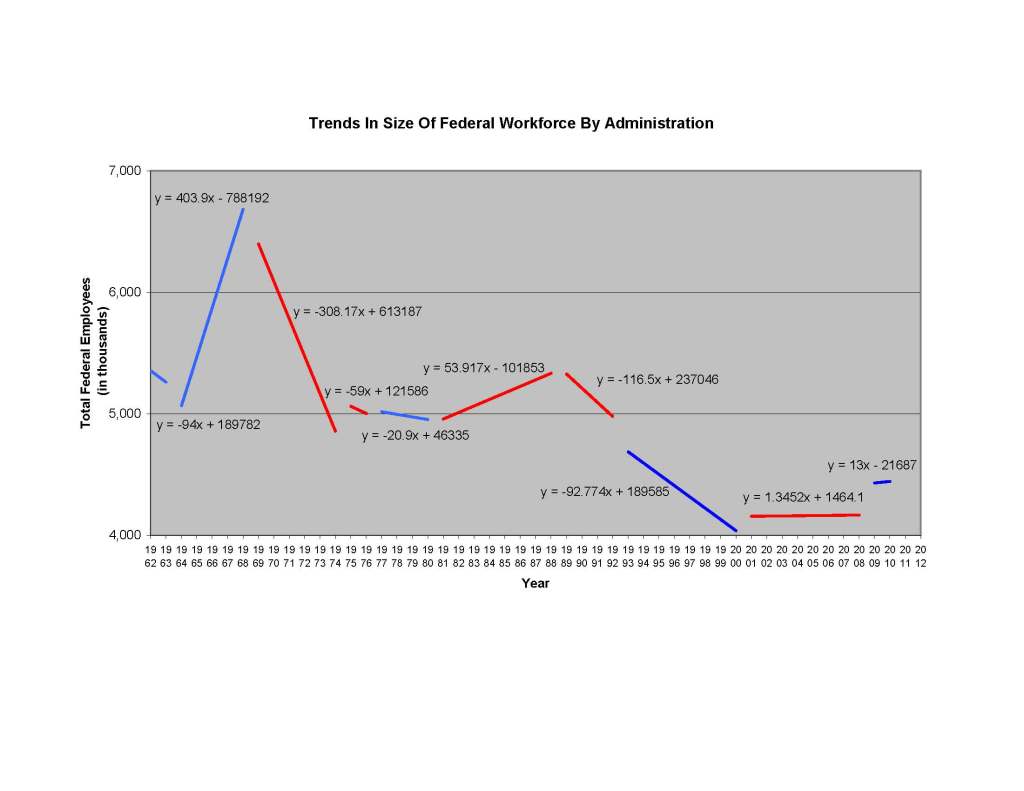

(Warning: Math/) Any spreadsheet can fit a linear regression. I made one for each president. My crude regressions have a slope and an intercept. Forget the intercept and look at the slope. The slope is the average change per year exhibited by that president. If the slope is positive, then the president increased the number of people working for the government. If it’s negative he decreased it. The size of the number is how aggressively this happened. A small slope means virtually no change. A big number means a big change.(/Math)
Ronald Reagan added just under 54,000 Feds a year. Overall he accumulated about 307,000 additional employees total in 8 years as head poombah. Based on America’s population in 1985, Reagan added a total of about 0.129% or more than 1/1000 of the citizenry to the already existing Federal force.
Delightfully, the numbers had backed up my statements! Almost a third of a million additions in eight years means the hero of small government somehow managed to hire another person every 10 minutes, day and night, weekends included, the entire time he was in power. I laughed hard enough to annoy my dog.
What about my boast that the two parties are pretty similar? I’d stated my theory that Republicans (which talk a big game about small government) had not behaved much better than the Democrats (which have never met anything that isn’t, in their eyes, under the purview of the Federal government). Was I correct?
On my chart there has been a Republican in charge 28 years and a Democrat for 21 years. Nice bi-partisan sample. All I needed was a weighted average of presidential “slopes” by party. Republicans cut 71,000 Fed jobs a year on average. Democrats add just under 50,000 employees a year. Ironically, Democrats rack up new hires roughly as quickly as Reagan did.
So I learned something new. With the exception of Reagan, the “small government party” does indeed reduce employees more than their counterpart. Fair ’nuff.
What else is there to learn? It looked like the Democrat’s record of adding Feds is almost entirely due to a spike that happened on Johnson’s watch. Every other Democrat (except Obama) shed jobs. What if I took out the spike?
As an experiment I zeroed out the temporary spike that is probably Vietnam. It started more or less in 1965 and it was more or less erased by 1972 (every job added on the way up was cut on the way down). Retaining the spike meant that Dems got the blame for the build up and Repubs got the credit for the reduction. (“Credit” and “blame” being dependent on your point of view.)
Removing the seven year spike didn’t change much. Johnson and Reagan remain the big expanders. Clinton and Nixon remain the big reducers. In keeping with the overall trend, Republicans reduce -42,000 Feds a year while Democrats shave only about -10,000. No matter how you slice it, (ditching Johnson’s buildup and keeping Reagan’s expansion) Republicans still generally cut the number of Feds 400% faster than Democrats.
You can split hairs further. For example I didn’t pro-rate changes between presidents. My chart implies that the day after Bush Jr. left office, a quarter million more Feds simply materialized out of thin air and neither Bush nor Obama had the slightest influence on that. Of course it could be examined, but doing so is a political hassle I don’t need. Nor does it matter. I wasn’t interested in what a specific pinhead politician did. My question was what the herd of pinheads have done en masse. Well, that and having fun taunting a friend over Reagan.
I sense commentary arguing either for or against a particular president or party. One could write books about how such and such unfortunate growth in the size of Government was totally necessary at the time because the Lemur harvest in Indonesia affected Boris Yeltzin’s left nut… Not interested. I’ve seen everything under the sun justified by very earnest people and it gets weird fast. All I care is what presidents of both parties did; what actually happened on their watch. In fact I pretty much don’t care what any of them said or intended. Presidents shouldn’t get a pass for having good intentions.
P.S. I used the following rough numbers for USA population in 1962 = 186,000,000, in 2010 = 281,000,000, and in 1985 = 238,000,000.)